The gap between signal and meaning
We often say that we want to measure crop stress or assess the phenological stage of a plant with a particular sensor. That is, however, a very imprecise way of describing what we are actually doing. A sensor does not directly measure “crop stress”, “soil health”, “water quality”, or “ecosystem function” in one simple step. Instead, it records a signal produced through an interaction between the sensor, the target, the measurement environment, and the way the measurement is made.
A thermal camera records radiance reaching its detector. A spectrometer records reflected light across different wavelengths. A soil-moisture probe records an electrical response related to the dielectric properties of the surrounding soil. An RGB camera records red, green, and blue digital values. Ground-penetrating radar records reflected electromagnetic energy. A gas analyser records a response related to the concentration of gases in a sampled air stream.
These signals can be highly informative. But they are not the same thing as the environmental properties that researchers, farmers, land managers, or policy-makers ultimately want to understand.
The work of sensing lies in making that relationship between signal and meaning explicit.
A measurement chain
A useful way to think about proximal sensing is as a measurement chain:
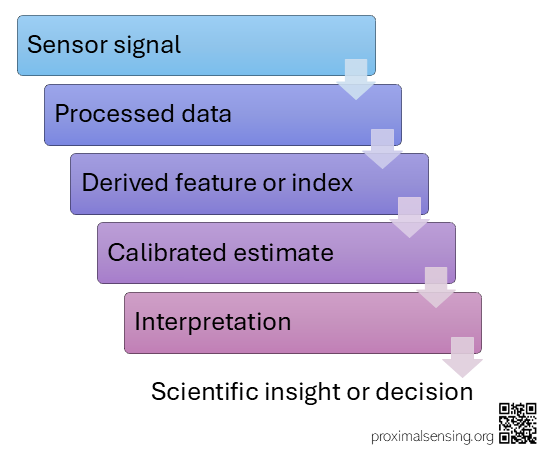
Figure 1: A typical proximal sensing pipeline from sensor signal through processed data, derived feature or index, calibrated estimate, interpretation to decision or scientific insight.
Every step in this chain involves a choice, an assumption, or sometimes a model. Some steps may be simple and transparent. Others may involve calibration experiments, physical models, machine-learning methods, quality filtering, spatial aggregation, or expert interpretation.
This chain does not make sensing less accurate. It is simply what is required to turn an observed signal into useful information. Making the chain explicit also makes it easier to understand where confidence comes from, where uncertainty enters, and where things can go wrong.
Signals are shaped by the measurement system
Imagine walking with a friend along a busy road. You are having a conversation, but there is a lot happening around you. Cars are passing, people are talking, the wind is blowing, and occasionally a loud truck passes between you. Your friend may still hear most of what you are saying, but the signal reaching their ears is influenced by everything happening between your voice and their ears.
Now imagine trying to understand exactly what was said from a recording of that conversation. The recording does not contain only your words. It also contains the background noise, the acoustics of the surroundings, the position of the microphone, the distance between you, and the characteristics of the recording device.
The same basic idea applies to measurement systems. The recorded signal depends on more than the target property we are interested in.
A thermal image of a crop canopy depends on canopy temperature, but it is also influenced by emissivity, reflected radiation, camera calibration, viewing angle, canopy structure, and the conditions between the target and the sensor. An RGB image of vegetation depends on leaf colour, but also on illumination, white balance, exposure, shadows, soil background, image compression, and camera processing.
In proximal sensing, the observer often has substantial control over these conditions. That is a major advantage. At the same time, it creates a responsibility to document measurement geometry, timing, sensor settings, maintenance, and processing.
A signal acquired with inconsistent geometry, for example, may reflect changes in the observation system rather than changes in the target.
The first question in any sensing workflow should therefore not be, “What variable does this sensor measure?”
A better question is: What signal does this system record, and which processes can influence it?
From signal to feature
Raw sensor data are often transformed before we interpret them.
A camera image may become a region-of-interest average or an RGB index such as a greenness indicator. A thermal image may become an estimate of canopy temperature after correction and masking. A spectral measurement may become a band ratio, a spectral feature, or a reflectance spectrum. A time series from a soil sensor may be filtered, aggregated, or converted into an estimate of water content.
A derived feature can be useful because it reduces the complexity of the raw data. It can reveal seasonal patterns, highlight differences, or create a variable that can be compared with another dataset. But every transformation also means that some information is lost or hidden. A single index value may not reveal that half of the target was in shadow, that the camera had moved slightly, or that an ROI had gradually begun to include more soil. Looking only at the final number can therefore make it easy to forget how much information was involved in producing it.
This is why raw data and processing steps should be retained whenever possible. A derived product becomes much more useful when users can understand how it was created and can return to the underlying observations if necessary.
From feature to estimate
A calibrated estimate connects a sensor-derived feature to a property of interest.
For example, a relationship may be developed between spectral features and leaf nitrogen, between a soil-sensor response and gravimetric water content, between image geometry and water level, or between thermal observations and a temperature reference. Calibration is not a universal conversion. It is a relationship developed under particular conditions. A model trained in one crop, soil type, season, sensor configuration, or viewing geometry may not work equally well somewhere else. Its transferability needs to be tested rather than assumed.
The quality of a calibrated estimate depends on the quality and representativeness of the reference measurements. It also depends on whether the calibration covers the range of conditions in which the system will eventually be used.
A model can be very precise within its calibration dataset and still produce misleading results when it is applied outside that range.
From estimate to interpretation
Interpretation is the point at which a measurement becomes meaningful within a scientific or practical context. To make this less abstract: A rise in canopy temperature may indicate water stress, but it may also reflect changes in radiation, wind, canopy structure, viewing geometry, or an error in the reference temperature. A decline in GCC may indicate senescence, but it may also follow mowing, grazing, flowering, snow cover, soil exposure, or a change in illumination. This is where additional observations become particularly important.
Weather observations, field notes, management records, images, plant samples, soil measurements, flux observations, drone imagery, and satellite data can all provide context. Proximal sensing is often most useful when it forms part of a wider evidence system rather than being treated as a single source of truth.
The conclusion we draw should match the evidence we have.
A sensor may provide evidence that a visible or thermal pattern changed. A calibrated and independently evaluated workflow may support a quantitative estimate of a particular property. A broader claim about plant condition, ecosystem function, or a management response requires additional interpretation and should make clear what evidence supports the conclusion and what uncertainty remains.
Accuracy, precision, and usefulness
Accuracy and precision are related, but they are not the same thing. A measurement can be precise, meaning that repeated measurements are very similar, while still being inaccurate if they are consistently offset from a reliable reference. A measurement can also be noisy while being unbiased on average. Neither accuracy nor precision alone determines whether a sensor is useful.
A useful proximal sensing system is one that is fit for its purpose. A low-cost camera may be highly useful for identifying the timing of crop emergence, even if it cannot provide a traceable estimate of chlorophyll concentration. A soil sensor may be useful for detecting relative wetting and drying at one location, even if its absolute moisture estimate requires site-specific calibration. A thermal camera may be useful for identifying spatial patterns in a crop, even when obtaining accurate absolute surface temperatures requires careful reference measurements.
Fitness for purpose should therefore be considered before deployment. It influences the sensor choice, reference measurements, acquisition design, calibration requirements, and acceptable level of uncertainty.
A practical reporting habit
Whenever a proximal sensing result is presented, it helps to state four things clearly:
1. What did the sensor actually record?
2. How were the data processed?
3. What property was estimated or described?
4. What evidence supports the interpretation?
Let’s look at an example:
“A fixed RGB camera recorded images of a grassland canopy every 30 minutes. Daily GCC values were calculated within a defined ROI. The resulting time series described seasonal changes in relative canopy greenness. Field observations of mowing dates and vegetation development were used to interpret abrupt and gradual changes in the curve.”
This form of reporting is simple, but it prevents a common problem: treating a derived number as if it were the environmental process itself.
The value of being explicit
Proximal sensing can produce detailed, frequent, and highly contextual observations. Its value is not reduced by acknowledging the chain between signal and insight. In fact, making that chain explicit makes measurements easier to understand, reuse, compare, and defend scientifically. The goal is not to demand perfect certainty from every field sensor. The goal is to understand what a system can show, what it cannot show, and what additional evidence is needed to move from an observed signal to a reliable conclusion.
A sensor does not tell us what the environment means. It gives us a signal. Our job is to understand how that signal was produced, how it can be transformed into useful information, and how far we can reasonably take the interpretation.
If you want to explore further, have a look at these articles:
Sudduth, K. A., Drummond, S. T., and Kitchen, N. R. (2001). Accuracy issues in electromagnetic induction sensing of soil electrical conductivity for precision agriculture. Computers and Electronics in Agriculture, 31 (3), 239–264. https://doi.org/10.1016/S0168-1699(00)00185-X
Anderson, M. C., Kustas, W. P., Norman, J. M., Hain, C. R., Mecikalski, J. R., Schultz, L., González-Dugo, M. P., Cammalleri, C., d’Urso, G., Pimstein, A., and Gao, F.: (2011) Mapping daily evapotranspiration at field to continental scales using geostationary and polar orbiting satellite imagery, Hydrol. Earth Syst. Sci., 15, 223–239, https://doi.org/10.5194/hess-15-223-2011
Sonnentag, O., Hufkens, K., Teshera-Sterne, C., Young, A. M., Friedl, M., Braswell, B. H., Milliman, T., O’Keefe, J., and Richardson, A. D. (2012). Digital repeat photography for phenological research in forest ecosystems. Agricultural and Forest Meteorology, 152, 159–177. https://doi.org/10.1016/j.agrformet.2011.09.009
Leave a Reply